
What is Support and Resistance? The most important and must-know concepts in the technical analysis.
Before, deciding on an Investible stock or finalizing a trade setup, Technical analysis is the most important concept. Support and resistance are the most unavoidable parameters among all forms of technical analysis.
Hence, based on these concepts, before proceeding further, we first need to understand this concept thoroughly.
Support and Resistance are the important price points in the chart of any security at which the security is expected to attract the maximum amount of buying or selling.
Then! What is Support and Resistance?
They are the points where there is a maximum probability of a pause or a reversal, of an ongoing trend. The logic behind them is simply demand and supply.
When the demand (buyers) is more than the supply (sellers) price of a stock increases and when the supply (sellers) is more than the demand (buyers) price of a stock decreases.
You might have heard “Buy Low and Sell High”, it means a lot to make money in any financial market (stocks, commodities, currencies, forex, etc.) This is precisely where support and resistance come into the picture. For this, one has to either buy at support and sell at resistance or sell at resistance and buy back later at support.
Most financial market traders use the concept of support and resistance as a major factor while trading in the market, whether it scalping, intraday trading, swing trading, or options trading.
What is Support?
It is the level at which the price of a Share does not fall further as the demand is quite enough to keep the price from falling further. When supply is more than demand, the price of the Share decreases and reaches to support level.
More and more buyers get interested in buying the share thereby demand becomes more than supply and hence price stops falling further and starts rising.
Support can be in the form of a single price level or the zone. Let’s consider this with examples further.
Support level or zone significant reference points from where the most repetitive buying (demand) has happened in the past and is same will is going to repeat ahead. It is an important entry point for a Buyer.
How to Plot the Support Level or Zone?
To draw support level or zone steps to be properly followed.
- Look at the historical price data. The first thing you need to do is to look at the past price data of any stock whose support level you want to find. Set your time frame according to your requirement of trade. For investment purposes you can consider a Daily or Weekly Time frame, for Swing trading set up a Daily or Hourly Time frame, and for Intraday 15 min or 5 Min time frame, and sometimes a 1 min time frame for Scalpers.
- Identify extreme lows and mark those points: Try to detect extreme lows price points or zones from where the price of a stock moves in an upward direction repeatedly. After identifying the extreme lows for the support level mark attach the arrow mark at these and try at least 2 to 3 more such points.
- Connect all the touch points: Here price point refers to a particular point from where there has been a sharp reversal in price whereas the price zone refers to a zone in which a price gets stuck after a brief down move. Once you are done marking all the touch points, the next step is to connect all those touch points.
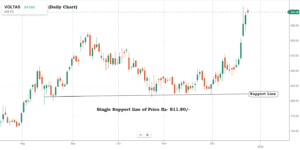
Example-1: Single Support Level
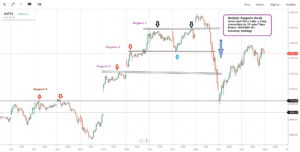
Example 2: Multiple Support Levels
Here Nifty 50 Index gives a sharp breakdown in 15 15-minute chart and breaks multiple supports. This kind of momentum if captured by Intrday traders and Options traders can generate massive returns.
Example 3: Support Zone
Most of the time support is not just a line or a price point, It could be a Zone or a range of Prices. For example, here Asianpaint has touched multiple support prices because the price has bounced back from multiple price ranges near to support zone. In this scenario, it’s better to draw a Support zone than a single support price. 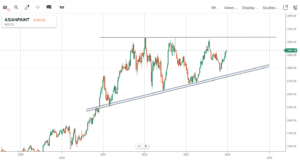
What is Resistance?
It is the level at which the price of a share does not rise further as the supply is quite enough to keep the price from rising further.
When demand is more than supply, the price of a Share increases. After the price reaches near the resistance level, more and more sellers get interested in selling the shares thereby supply becomes more than demand, and hence price stops from going up further and starts falling.
Sometimes I take the help of #Chartink screener for scanning the daily support and resistance of Indian Stcoks.
How to Plot Resistance Level or Zone?
To draw the Resistance level or zone, following steps to be properly followed.
- Look at the historical price data. The first thing you need to do is to look at the past price data of any stock whose resistance level you want to find. Set your time frame according to your requirement of trade.
- Identify extreme highs and mark those points: Try to detect extreme highs price points or zones from where the price of a stock moves in a downward direction repeatedly. After identifying the extreme highs for the resistance level mark or attach the arrow mark at these and try at least 2 to 3 more such points.
- Connect all the touch points: Here price point refers to a particular point from where there has been a sharp reversal in price whereas the price zone refers to a zone in which a price gets stuck after a brief down move. Once you are done marking all the touch points, the next step is to connect all those touch points.
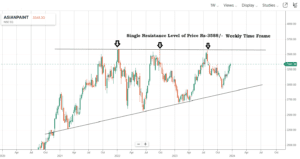
Example-1: Single Resistance Level: The single resistance level of ASIANPAINT is Rs-3588/-, It is making a narrow chart pattern that is going to give a breakout above the resistance level or a breakdown below the next support point.
Example 2: Multiple Resistance Levels
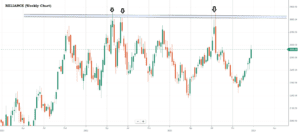
Consider the Reliance share price which in a weekly chart, the price has touched multiple Resistances. After the share price touches more than 3 or 4 times the resistance level, there is a strong chance that the next time share can give a positive breakout overtaking the resistance.
Example 3: Resistance Zone: If you carefully look at the image below, the Nifty Multiple Resistance price is indicated.
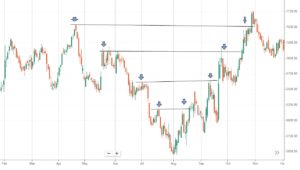
Important point to take care of, Support or Resistance is not always a single price level, it could be a zone.
Now after having understood the concept of support and resistance, below I have shown some more examples showing both support and resistance on the same chart.
What is Support and Resistance and Support Resistance Reversal?
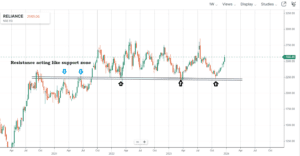
Resistance acting like a support zone
In the candle stick chart, most of the time a particular resistance worked as a Support. This happens when the price has given a breakout of Multiple resistance points/Zone. In the below example, The Reliance price has given a breakout of resistance of Rs- 2200 to 2210 price zone. After that same resistance becomes the Support for a bounce back, if the current support fails then the Price will fall back to Rs- 2010/-. Sometimes if the Support is not available nearby then the Roundup Price (1000,1500,2000 etc) becomes the Support.
Hi Reader If you have read here till now, you are very keen to understand the price action and investment. Based on this technical analysis, I have used the skill to decide the Yes Bank share price target for 2025 and more which may help you to invest.
Frequently Asked Questions(FAQs)
Why Support line and resistance line is important for Chart Analysis?
These are important Price reference points from where share prices either go up from support or come down from resistance.
Is the Resistance point can act as a Support price?
Yes, when Share gives a breakout overtaking the resistance level, then when the price falls from the upper price, it takes a pause or bounces back from the previous Resistance level. (also called the xqnew support level). This is an important part of technical analysis.
8 thoughts on “What is Support and Resistance?”
Comments are closed.