
The Marubozu candlestick pattern is a single candlestick pattern which means “Bald” in Japanese. In the technical analysis of Candlestick, marubozu has no upper or lower wicks (tale) like in the following picture. In Price Action Trading Marubozu Candlestick plays an important decision-making pattern, lets understand it how?
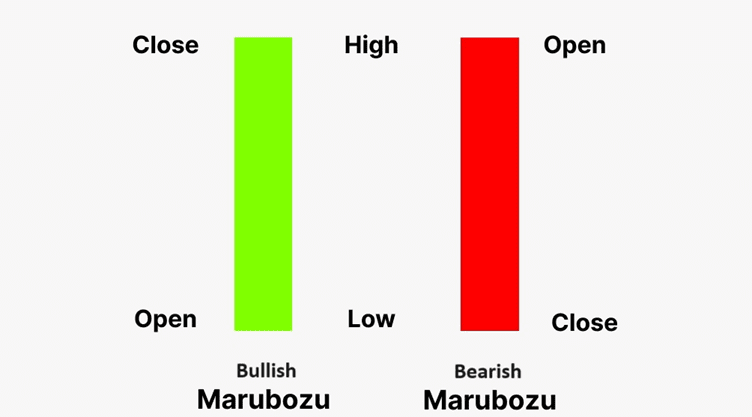
In this form of candle price Open = Low, and Price Close=High.
It’s a continuation candle where the next candle continues to up or down.
Basically Marubozu candlestick is of two types.
1-Bullish Marubozu Candlestick pattern
2- Bearish Marubozu Candlestick pattern
1- Bullish Marubozu Candlestick pattern: When the real body is entirely bullish (i.e., the closing price is significantly higher than the opening price, it signals strong buying momentum. A bullish marubuzo indicates that there is so much buying interest in the stock that the market buyers were willing to buy the stock at every price point during the time frame, so much so that the stock closed near its high point.
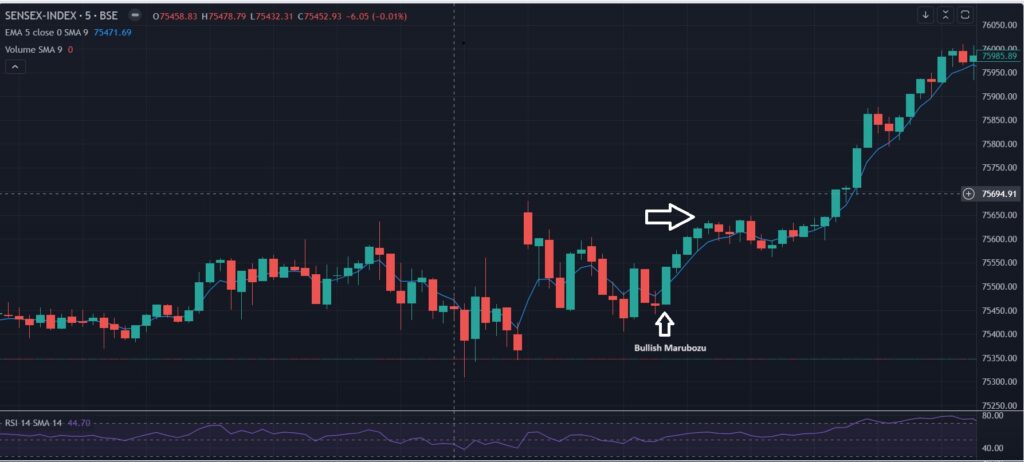
It does not matter what the prior trend has been, the action on the bullish marubuzo suggests that the sentiment has changed and the stock is now bullish. This change in sentiment there is a surge of bullishness and this bullish sentiment will continue over the next few candles. Hence a trader should look at buying opportunities with the formation of a bullish marubuzo. The buy price should be around the closing price of the marubuzo.
Lets understand from the Chart of Sensex. In the marked Bullish Marrubozu, the entry/ Buying point around at Rs 75509 and stoploss at Rs 754663. The target profit can be booked after next two candles that is at point Rs 75615. An almost 1:2 risk reward ration.
2- Bearish Marubozu: It indicates extreme bearishness, Here the open is equal to the high and close the is equal to low. Open = High, and Close = Low. A bearish marubuzo indicates that there is so much selling pressure in the stock that the market participants actually sold at every price point during the day, so much so that the stock closed near its low point of the day.
It does not matter what the prior trend has been, the action on the marubuzo day suggests that them sentiment has changed and the stock is now bearish. The expectation is that this sudden change in sentiment will be carried forward over the next few trading sessions and hence one should look at shorting opportunities. The sell price should be around the closing price of the marubuzo.
How to Trade Marubozu Candlestick Pattern
Trade stoploss should be either top or button of the Candle. lets understand with an example.
In the below NIFTYBANK 15Min chart pattern, one Bearish marubozu observed with very good Risk reward ratio of 1:3. The stoploss is Rs 48310 and entry price between 47663 to 47650. But next three candle made huge profit-making scenario for a intraday trader.

However In candlestick analysis no pattern is 100% predictable everytime. Every pattern has an accuracy till 60-70% and with this much of preditibilty also people make money with proper money management setup. When you do lose, try to book it early with a stoploss and when you are becoming profitable, then wait until your target is achieved or almost achieved.
When to avoid Marubozu Candlestick Pattern ?
Dont chase a very tall or short marubozu candlestick pattern like in the figure below.
Very Tall Marubozu has a drawback like its stop-loss is too deep than the profit target, Similarly in short Marubozu, risk-reward is not proper and very unpredictable for the next move.
During Trading understanding What is support and resistance is very important, Let know-how in this article.
Similarly, in some cases any Marubozu fails due to certain news or trend changes, that uncertainty persists only a few percent. Always try to follow the best money management, and put a stoploss in every purchase.