Visually, it looks like a hammer (or maybe Thor’s tiny Mjölnir) with a long handle. It’s like spotting a friendly little hammer in the wild jungle of stock charts. Let’s understand it clearly and discuss about trading strategies like never before. You can read and download the Hammer candlestick pattern pdf here.
What is a Hammer candlestick pattern?
The Hammer candlestick pattern is an important chart pattern that occurs at the bottom of the trend. This candle stick pattern is formed by a candle with a small body (the difference between open and close prices) with little or no upper shadow and a long lower shadow. It is a Bullish reversal candlestick pattern.
Generally, in this hammer pattern, the lower shadow should be at least twice the size of the real body. The colour of the real body can be red or green. However, the hammer formed with a green real body and longer shadow gives a stronger bullish signal as a warning signal for a potential upside reversal.
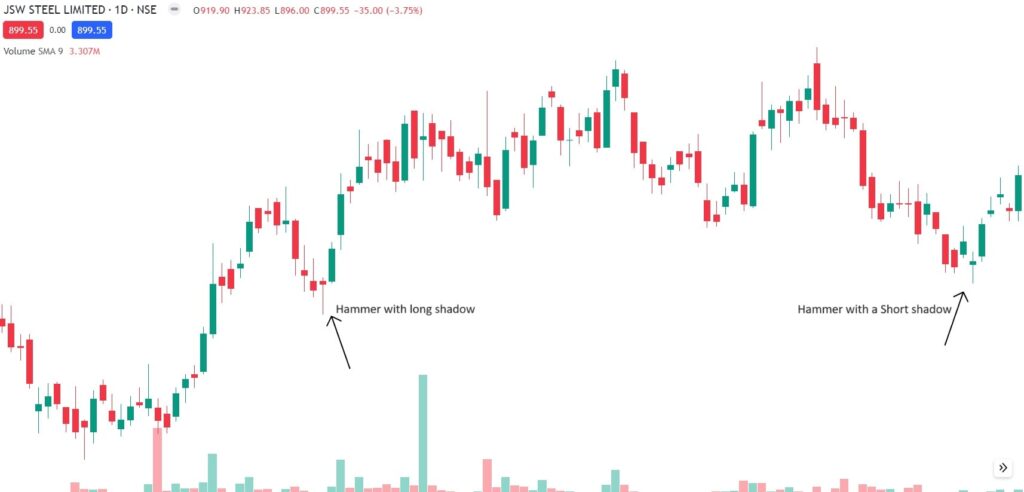
In the chart below you can recognize the formation of the hammer candlestick pattern at the bottom of a downtrend.

At first, a Red Hammer candlestick with a long shadow formed at the bottom, which indicates the strong reversal of the market. Immediately in the next day, the bullish breakout candle formed changing to an upside trend.
For an investor or day trader, the entry point is the previous day’s close price, and stop loss at a few points below the day’s open price. The Question is Why its mentioned a few pints below the Day’s open price not at the exact day’s open price is explained little below.
In the second, the Green Hammer candlestick with a short shadow formed also indicates the trend reversal at the bottom. However, the trend is not as bullish as the first one, the bullish trend fades away sooner. So, it concluded the short-tail hammer candles don’t show a strong reverse uptrend like long-tail hammer candles, irrespective of colour.
How a Hammer candlestick is formed ? and what is the thought process?
This Story must be Read to understand the deep.
The market is in a downtrend, where the bears are in absolute control of the markets. Everyday market was opening with a lower price than previous day or making any way the red candles.
But one day comes downtrend in takes a pause, but, How? Sellers are trying to pull the market down, but buyers start entering in a large volume and dominate the sellers, bouncing back from lower price to a day’s opening price. This hustle between buyers and sellers helps to form a Hammer candlestick pattern.
After that day, the next day buyers take control and shift the market uptrend with a major volume and the Bulls making profit. Off course, the bull run will not continue all the time, it will take a pause once the buyers start booking profits after 2-3 trading sessions.
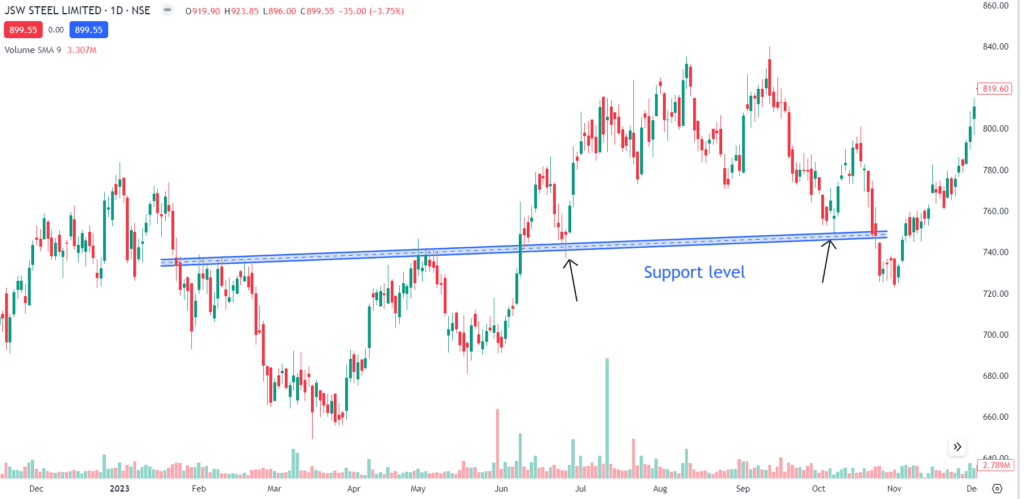
This is the thought process behind the Hammer candle formation and how a trader should take entry and when. The most important thing for a Trader or a Swing trader is to find out the Resistant and Support level. Mostly the the hammer candlestick pattern is formed at the Support level of a chart chart pattern.
Just have a look the chart below which is an extension chart of JSW Steel given above. The first hammer formed at the exact support level (price band around Rs-739-740.45) and second green hammer candlestick is formed at second support price level ( Price band Rs 750-753.85) the hammer candle is formed. This confirms, the hammer candlestick in downtrend is a reversal of trend to upside. This is mostly correct if formed at the support level.

Sometimes, formation of a double hammer candlestick at the middle/at the downtrend confirms the trend is going more uptrend with the flow. If you analyze another chart given below where a channel breakout pattern is happening in Power fin Corp Ltd share.
How to trade a Hammer candlestick pattern?
The formation of a hammer suggests a long trend upside. But trading always attached with risk and reward in a relatable ratio. The way a risk taking trader looks the hammer candle, a risk avoiding trader mayn’t look. So, there will be two different approaches we can discuss here.
Risk takers are the daredevils of the stock market. They’re the ones who bungee jump off cliffs and buy stocks on the same day they spot a hammer. A hammer will be clearly visible 3:20 to 3:25 PM of the day, that time, if you’re a risk taker, you can go buy the stock immediately.
If you’re risk avoider (a calm with a cup of tea kind of trader), here is your approach:
Wait until the day after the hammer has formed. Wait till the next day opening, if the candle open with green that means higher open price than previous day close price, then entre and ride the bull journey.
However if the Next day candle opens at lower price making a red candle, then risk avoided, may avoid trading that day.But the risk taker who have already entrerd from previous day, have to book with a loss.
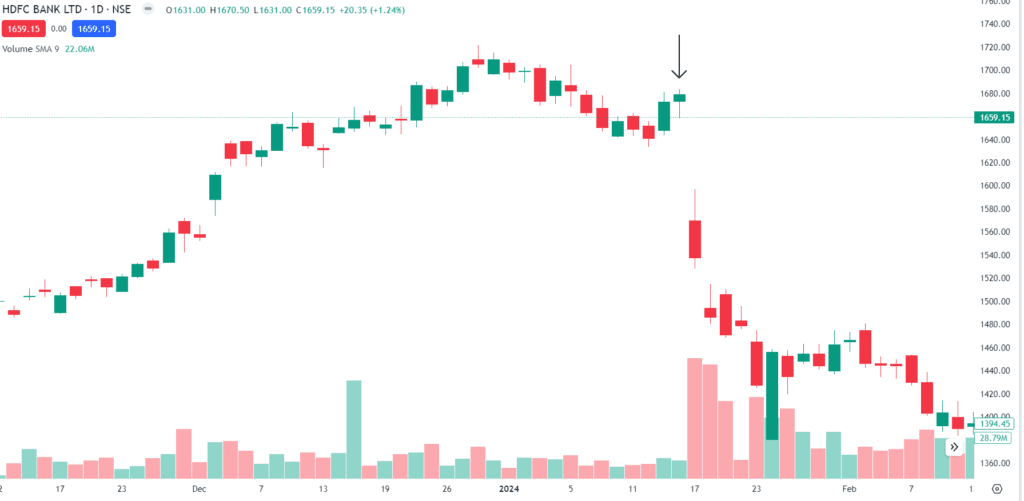
Lets see the Candlestick chart of HDFC Bank Ltd, hammer candle failed completely, with a large gapdown in price next day. Although this could be due to some bad news, or Bad quarterly result or whatever, the loss has to be booked by Risk taking trader.

In stock market no one is 100% accurate, if accuracy rate is 60-70% you can maintain then its profitable business. But how to minimize the risk in this kind of uncertain price movements?
First: Buy only few amounts according to your risk appetite, then wait till next day morning movement, if its going with your analysis, then buy more shares. If price pattern goes against you, means if red candle is formed, then sell the holdings.
Before placing order on 3:20 or 3:25 pm, alert with the bad news about the stock, avoid buying if quarter result going to declare or stock price going to split next day.
If the Hammer candlestick is not formed at the support price level of a chart pattern, then bit more alert, it may fail.
These are some points how a Risk trading can be minimized.
Conclusion:
A hammer formation at the bottom line in a downtrend indicates a reversal of trend.
More is the shadow or tail of hammer, more could be the upside momentum.
A hammer candlestick pattern if formed at support level in a chart pattern then it has more probability of being upside.
A double hammer candlestick pattern confirms more assurance of Upside trend.
To read the inverted hammer candle in the next article stay attached with us.
Frequently Asked Questions (FAQ)
What is a Hammer candlestick pattern?
This candle stick pattern is formed by a candle with a small body with little or no upper shadow and a long lower shadow. It is a Bullish reversal candlestick pattern.
What a hammer candle formation indicates?
It indicates a potential bullish movement giving a pause from the downtrend.

